 TapSum
In this article
Short answer: most people predict they will spend less than they actually do, often by 15-30%. The reason is not carelessness. When we forecast, we picture a typical week, but the real average is pulled up by rare, irregular costs: a repair, a gift, a doctor's bill. The fix is to plan from your recorded average and to deliberately think about what could make the next month unusual.
Which spending do people predict worst?
Students predicted $39 for unusual expenses and spent $70. Ordinary spending was almost exact: $83 predicted, $81 spent.
What the research shows
People underpredict, and by a lot
In a five-week field study with members of a Canadian credit union, researchers asked people to predict their spending and then compared it with what they actually spent. Monthly predictions averaged $2,277, while actual spending averaged $2,694: about 15.5% lower. Nearly two out of three participants (63%) underpredicted. (Howard et al., 2022)
That study is part of a larger paper with ten studies and more than 6,000 participants, and the pattern held across them. Earlier work by psychologists Johanna Peetz and Roger Buehler found the same thing in weekly forecasts: people expected to spend less next week than they did, on average underestimating by about 27%. They called it the "budget fallacy." (Peetz & Buehler, 2009; Peetz, 2010)
Why: the "typical week" is not the average week
Here is the key insight from Howard and colleagues. Spending is skewed: most weeks look similar, but every so often a big, unusual expense arrives. When we predict, we imagine the usual week. The usual week sits below the true average, because the rare expensive weeks are what push the average up.
A simple example. Say your last ten weeks looked like this:
| Weeks | Spending per week |
|---|---|
| 8 ordinary weeks | $300 |
| 1 week with a car repair | $520 |
| 1 week with a birthday and a dentist visit | $780 |
Your "typical" week is $300. Your average week is $370. If you budget $300, you will come up short by about 19%, even though you described your normal life perfectly.
Typical week vs real average
Illustration, not a forecast.
Ordinary expenses are easy. Exceptions are not.
Marketing researchers Abigail Sussman and Adam Alter found that people are surprisingly accurate about ordinary purchases and badly off on exceptional ones. In one study, students predicted their spending for the coming week. For ordinary items they predicted $83 and spent $81. For exceptional items they predicted $39 and spent $70. (Sussman & Alter, 2012)
Predicted vs spent in one week
Sussman & Alter, 2012, n = 64.
Their explanation: we treat each unusual expense as a one-off ("the wedding was special," "the laptop broke, that never happens"), so we never learn that some exceptional expense shows up almost every month. That study was small (64 students completed both surveys), so treat the exact numbers as an illustration. The broader pattern has been replicated in the later work above.
Wanting to save makes the forecast worse
Peetz and Buehler found one more twist. People with stronger savings goals predicted lower spending, but their actual spending was no different. The goal changed the forecast, not the behavior. (Peetz & Buehler, 2009)
In other words, "I'll spend less next month" is often a wish dressed up as a plan.
What actually helps
The good news: the same studies tested simple fixes, and some of them worked well.
Asking "what could be different?" In the credit union study, people who were prompted to think about reasons their spending might be unusual made predictions that were 36.7% higher, and their remaining error was no longer statistically different from zero. In a separate field experiment with 1,738 users of a UK personal finance app, the same prompt cut the underprediction on online shopping from 32% to about 2%. (Howard et al., 2022)
Two caveats worth knowing. First, listing three reasons worked about as well as listing ten. Second, the prompt did little for groceries, a category that is already steady. It helps where spending is lumpy.
Thinking through specific events. In Peetz's research, asking people to walk through the concrete purchases they expected in the coming week reduced the influence of their savings goals and removed the bias in weekly predictions. (Peetz, 2010)
Seeing exceptions as a group. Sussman and Alter found that when people were reminded of similar past occasions (for example, earlier gifts they had bought), they spent less on the next one. They suggest giving exceptional expenses their own category in your budget, though that specific idea was not tested directly. (Sussman & Alter, 2012)
Five steps for a more honest budget
- Plan from your average, not from memory. Look at what you actually spent over the last two or three months and use the average, not the month that "felt normal."
- Before each month, write down three reasons it could be different. A birthday, a trip, a car service, a yearly subscription renewing. Three is enough.
- Give exceptions a home. Add one budget line for irregular and one-off costs. If it stays empty, that's fine. It almost never stays empty.
- Separate the goal from the forecast. Write two numbers: what you expect to spend and what you want to spend. Close the gap with a concrete action, not with optimism.
- Record spending as it happens. You can't average what you didn't write down. A few seconds per purchase is enough to make step 1 possible.
Tick the steps as you go
0 of 5 done
FAQ
Why do I always spend more than I budget?
Because people plan around a typical month, while the real average includes rare, irregular costs such as repairs, gifts and medical bills. Those rare costs push the average above the typical month.
How much do people underestimate their spending?
In a field study with credit union members, monthly predictions were about 15.5% below actual spending. Other studies found weekly underestimates of around 27%.
How can I predict my spending more accurately?
Plan from your recorded average over the last two or three months, and before each month list three reasons it could be different from usual.
How to do this in TapSum
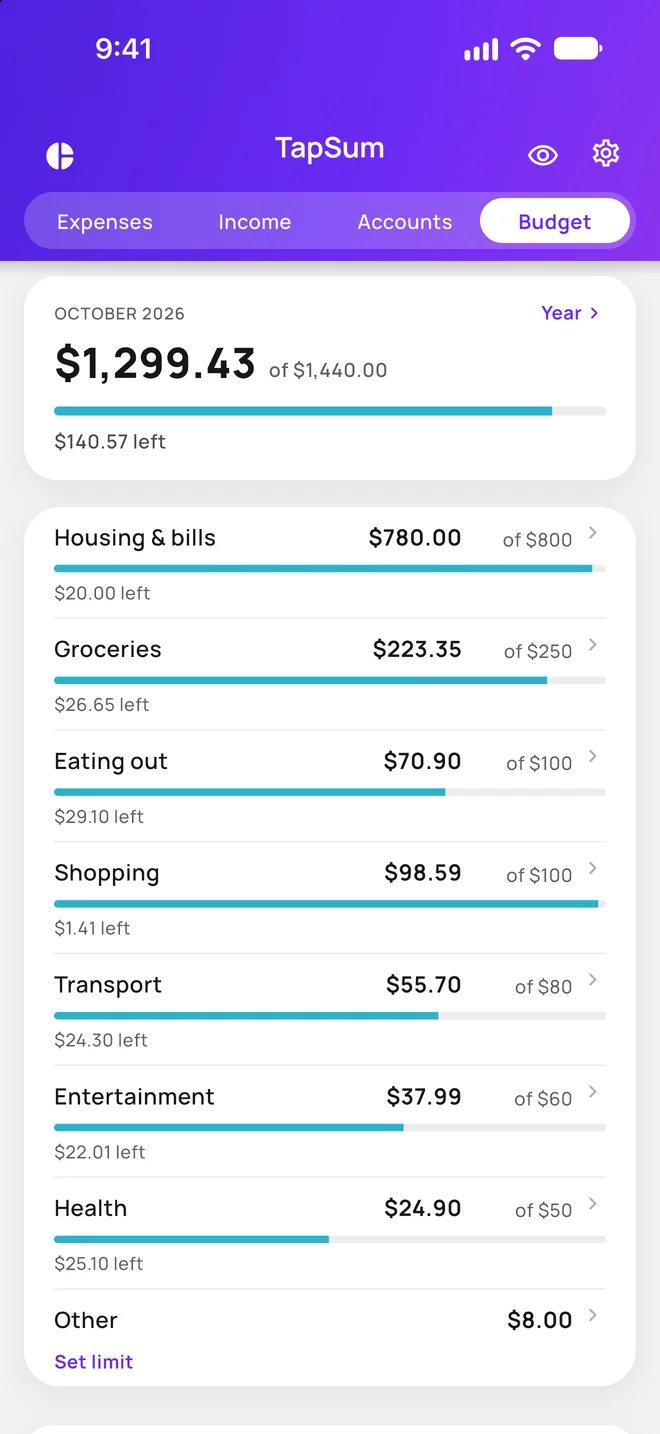
TapSum is built for step 5: you log a purchase in two taps (amount, category, done), so your real average builds up without effort. Monthly totals then show what a normal month really costs, budgets let you set a separate line for irregular expenses, and a big yearly payment can be spread across months so it doesn't distort a single one.
Sources
- Howard, R. C., Hardisty, D. J., Sussman, A. B., & Lukas, M. F. (2022). Understanding and neutralizing the expense prediction bias: The role of accessibility, typicality, and skewness. Journal of Marketing Research. doi:10.1177/00222437211068025 (open PDF)
- Sussman, A. B., & Alter, A. L. (2012). The exception is the rule: Underestimating and overspending on exceptional expenses. Journal of Consumer Research, 39(4), 800-814. doi:10.1086/665833
- Peetz, J., & Buehler, R. (2009). Is there a budget fallacy? The role of savings goals in the prediction of personal spending. Personality and Social Psychology Bulletin, 35, 1579-1591. (publication list)
- Peetz, J. (2010). The "Budget Fallacy": Sources of accuracy and bias in personal spending predictions (Doctoral dissertation, Wilfrid Laurier University). scholars.wlu.ca/etd/1101
Not financial advice. This article summarizes published research for general information.